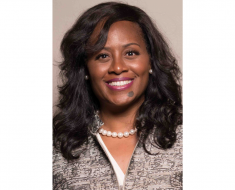
Guro Dahl Lindbjerg, Country Manager, Retriever Norway, and Head of Analysis, Retriever Group, in her session at the AMEC Summit talked about how they used media data to measure the effect on a societal level in an unconventional manner.
Measuring impact can be a task as it is not enough to measure for awareness for change in perception and attitude. Many communicators find themselves lost in the evaluation. In these moments, it is important to remember that traces of changes lie right in front of us, in what surrounds us every day – in media data. Media data hold a manifestation of our contemporary society referring to a picture of Bill Murray. It is present not only in pictures, posters, and films but also in editorial coverage of events, accidents, happenings, topics in the opinion pages, in social media. The impact can be traced in the data, many of us work with every day. This can be used not only for social research but also for communicators working their way out of lostness and onto the right path towards reaching their impact goals.
Three ways out of lostness
None shall drown: Sea Rescue
Citing a client example of a rescue vessel that saved thousands of people from drowning at sea, Lindbjerg said, their vision statement none shall drown comes with a strategy of precise goals to help them reach their mission. This strategy includes spending time and resources on communications to share preventive information, policy mobilisation for rules and regulations, and physical measures like printing of life, voice and actual rescues, using the vessels. All of this is done with the ultimate goal of decreasing drownings, a goal to improve, not to measure.
But how exactly do you measure the developments of drownings and the impact of their work? Lindbjerg said, one could gather official statistics which would be the perfect solution, but the problem was there were no statistics on it in Norway. What helped them was looking at media data – by searching editorial coverage for new spaces on drowning accidents, create actual monthly statistics on drownings. The local newspapers wrote about all the incidents including details of where the incidents took place including their gender and nationality. And if any uncertainties arose, the Sea Rescue team contacted the police for verification. This way, Sea Rescue has been able to measure the impact on drownings and it gave them a tool for steering the communication to maximise the very important and life-saving impacts and it also gave them a tool to understand the problem.
The lack of full-time nurse positions
In Norwegian labour markets, professions that have traditionally been held by women are still organised as part-time positions and therefore Norway witnessed a shortage in the positions of full-time nurses. But the changing perceptions and gender equality values more and more women started seeking full-time jobs but were unable to find them because of the existing structural mechanism. The regional nurse’s organisation took the responsibility to solve this issue. Their strategy was to use communication to bring in policy changes to increase full-time positions. But the block was there was no data available on part and full-time positions. What they then turned to was publicly available data. The positions were advertised, and the team registered each unique advertised position while also collecting geographical data and whether it was in public and private healthcare. This enabled the team to steer their communication for maximum impact and understand the problem – who continues to advertise for part-time positions.
The ultimate proof media data describes our contemporary society: Describing and predicting GDP
Moving on to the final leg of her presentation, Lindbjerg explained how Retriever Group used media data to describe and predict GDP for Norway. This was not done for any client but made for a rather big scale impact measurement used not only by communicators but by financial and banking analysts in Norway. What they did is describe the GDP solely based on media data and more frequently than the official reporting.
Financial News Index (FNI): The central idea behind the index is pretty simple. To the extent that newspapers, provide a relevant description of the economy, the more intensive, a given topic is represented in the newspaper at a given point in time, the more likely it is that this topic represents something of importance for the economy’s current and future needs and developments.
Explaining what they did in short, Lindbjerg said, applying machine learning models they identified topics in editorial, media, and the sentiments in large newspaper corpus. As a first step, extensive research on time series of news content and GDP figures, going back to the 1980s was done. Through this they actually made a model that actually describes the GDP at any given moment, based only on media content and data.
Projecting the financial news index, Lindbjerg said, this was Norway’s map out of lostness, and the index has proven to accurately describe the development in GDP, at a higher frequency than the official source. It is updated monthly and can be accessed free of charge and is used by financial and banking institutions to measure, a large impact on the societal level. Lindbjerg had one key takeaway for the audience, “Whenever you feel lost, looking for a way to measure societal impacts, remember Bill Murray. And look for the answer in the media data”.
To sum it up, some organisations work towards structural change on a societal level, and these effects can be hard to measure. But traces of events, understandings and change can all be found in media data. A manifestation of our common contemporary society lies right in front of us and can be used not only for social research but also for communicators working towards their impact goals.
(Session coverage by Julia Joseph, AvianWE)


